HOME >> BUSINESS
China's economic and social development in 2012
Source:Xinhua Published: 2013-2-23 17:34:36
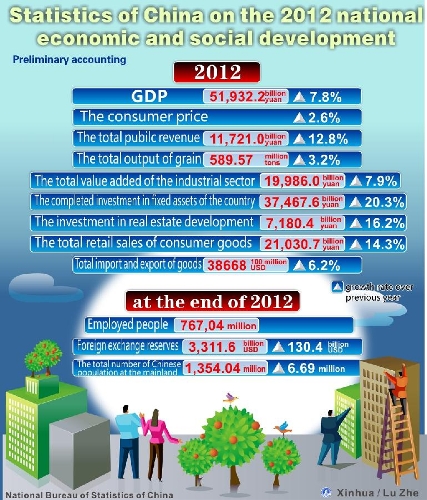
Graphics shows the statistics of China on the 2012 national economic and social development issued by National Bureau of Statistics of China on February 22, 2013. (Xinhua/Lu Zhe)
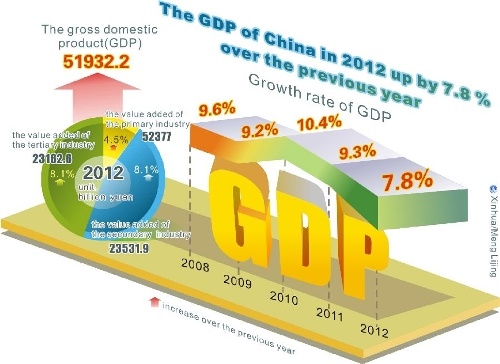
Graphics shows gross domestic product and growth rates from 2008 to 2012 issued by National Bureau of Statistics of China on February 22, 2013. (Xinhua/Lu Zhe)
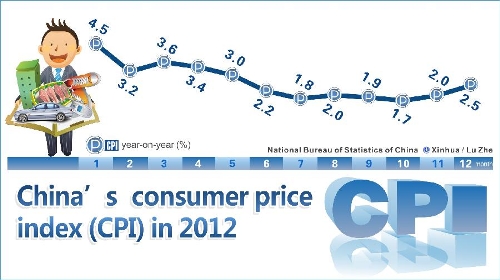
Graphics shows the year-on-year growth rate of consumer prices in 2012 in China issued by National Bureau of Statistics of China on February 22, 2013. (Xinhua/Lu Zhe)
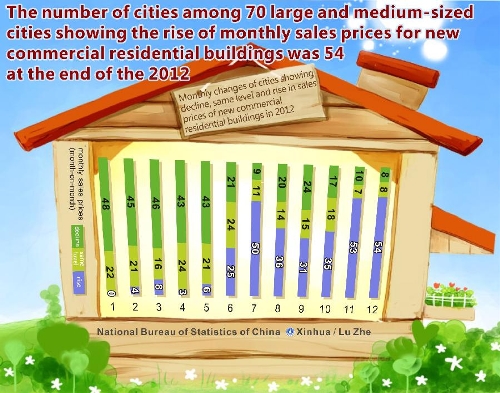
Graphics shows monthly changes of cities showing decline, same level and rise in sales prices of new commercial residential buildings in 2012 in China issued by National Bureau of Statistics of China on Feb. 22, 2013. (Xinhua/Lu Zhe)
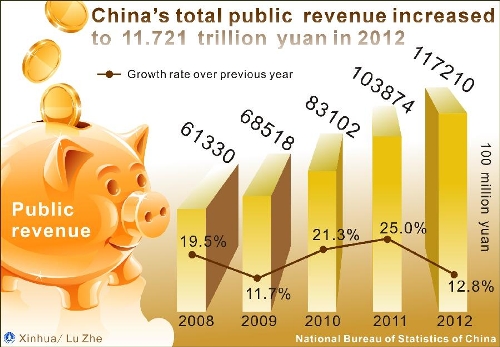
Graphics shows China's public revenue and the growth rates from 2008 to 2012 issued by National Bureau of Statistics of China on February 22, 2013. (Xinhua/Lu Zhe)
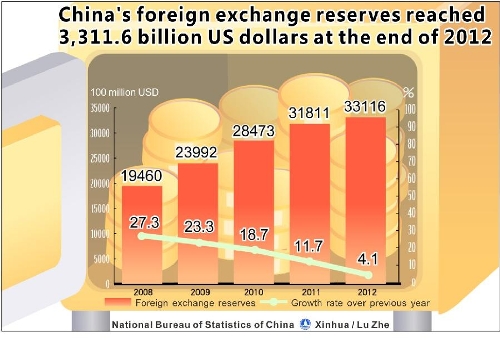
Graphics shows the figure of year-end China's foreign exchange reserves and the growth rates from 2008 to 2012 issued by National Bureau of Statistics of China on February 22, 2013. (Xinhua/Lu Zhe)
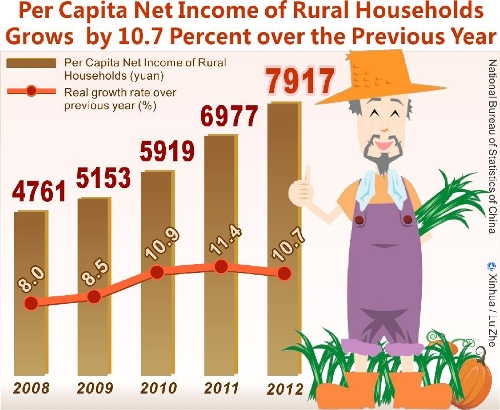
Graphics shows the figure of per capita net income of rural households from 2008 to 2012 issued by National Bureau of Statistics of China on February 22, 2013. (Xinhua/Lu Zhe)
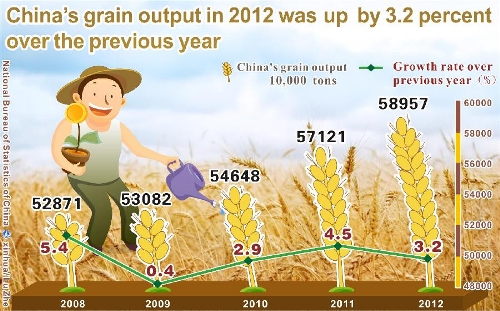
Graphics shows China's output of grain and the growth rates from 2008 to 2012 issued by National Bureau of Statistics of China on February 22, 2013. (Xinhua/Lu Zhe)

Graphics shows the figure of total retail sales of consumer goods and the growth rates from 2008 to 2012 issued by National Bureau of Statistics of China on February 22, 2013. (Xinhua/Lu Zhe)
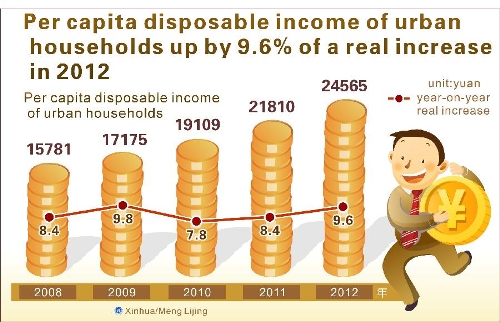
Graphics shows the figure of per capita disposable income of urban households and its growth from 2008 to 2012 issued by National Bureau of Statistics of China on February 22, 2013. (Xinhua/Lu Zhe)
Posted in: Economy